


 Happy New Year! I know that we tend to stay away from the actual topic of real estate during these posts each month. That being true, I thought that with all of the conflicting reports these days, a little professional perspective could help you to understand what’s happening out there.
First and foremost, with real estate numbers and predictions, it’s always important to understand that real estate is local… city by city, block by block. Where national numbers have obvious influence on markets and consumer confidence as a whole, they should never be confused with YOUR local market, at https://inboundrem.com you can get to understand more real estate.
So, I wanted to take this opportunity to share some insight on the real estate market both in Chicago AND the national perspective. If at ANY time you have further questions on your particular home or neighborhood, please contact your Chicago Home Partner.
Home Prices in 2013 – Nationally and Locally
 Probably the most common question I get when either sitting down with a buyer or sitting in a listing presentation is, “what’s going on with prices?” With a barrage of “half baked” statistics in the media, it’s easy to buy into the headlines.
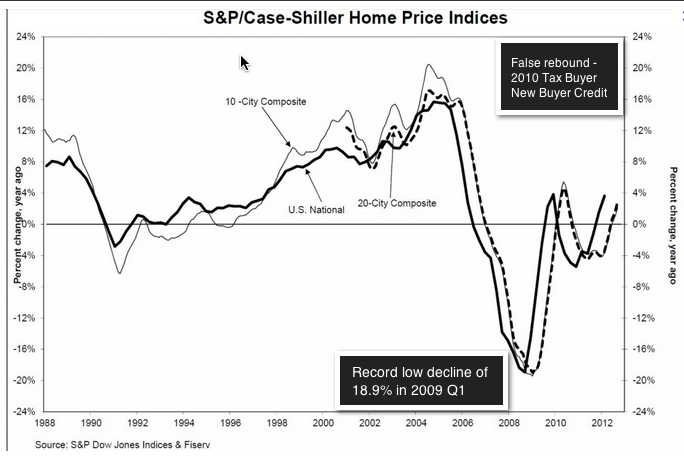
In a recent Time Magazine article the Associated Press was quoted with the following. “The Standard & Poor’s/Case-Shiller national home price index increased 4.3 percent in October compared with a year ago. That’s the largest year-over-year increase in two and a half years, when a homebuyer tax credit temporarily boosted sales. Prices rose in October from a year ago in 18 of 20 cities except Chicago and New York.”
Increased Home Prices Don’t Mean Increased Home Values
The trend for that we have seen for North Side Chicago neighborhoods in the last year is that PRICES of sold properties HAVE actually increased. What the numbers DON’T tell you is that home VALUES aren’t necessarily increasing. Instead, consumers have shifted towards buying larger homes in more established, more expensive neighborhoods.
When comparing 2012 versus 2011 for these neighborhoods the proof is there is you dig deep enough. The average square footage  of units sold in 2012 was more than 100 sq./ft. more than 2011. Essentially it’s larger properties selling in more expensive locations, that’s driving the increase. These properties are still selling around 2003 prices, just with larger price tags due to their location and size. Time to sell my house fast Dallas TX, I believe.
So what does this mean for 2013? Remember that real estate is local – neighborhood by neighborhood and block by block. Influenced by a number of other factors discussed throughout this report, it appears that we are poised to potentially turn the corner in many Chicago neighborhoods. For more specific information on your specific home PLEASE contact us to perform a comparative market analysis, and we will be happy to share it with you.
Growing Demand and Limited Supply for “Desirable” Housing
One of the most important and influential trends we have seen not only in Chicago, but in the nation as a whole, is the shortage of well-priced, desirable inventory in sought-after neighborhoods.
NAR numbers show 5.4 months’ inventory of homes for sale at the current pace, 22 percent below where it was a year ago and the lowest inventory since February 2006. Limited inventory typically translates to shorter market time for well-priced listings and in many cases leads to multiple offers. This is definitely a good sign for the market over all and is key to driving eventual price increase. Why the shortage?
From a SUPPLY perspective, there are a number of factors that have influenced this shortage, but in Chicago it comes down to only a couple.
 Those that can afford to take a hit on their home price, already have.
- Those that can’t, are continuing to sit tight and wait for appreciation.
- 20% less distressed homes are actually hitting the market.
- There’s a total lack of (quality) new construction for sale properties.

Economist Calvin Schnure states, “Construction of new homes and apartments needs to be between 1.25 and 1.5 million a year just to keep up with population growth. But since the housing crash, new construction has been at 500,000 units or fewer for 6 years running—that’s actually created a shortfall in available homes.”
From a DEMAND perspective, there are some main points that are driving the increase here in Chicago, and are discussed in greater depth later in this report.
- Historically low interest rates continue to be a driving factor.

- Consumer confidence and with lower unemployment.
- Flattening of prices in the more desirable neighborhoods.
- Rising rental rates have many questioning the rent vs. buy dilemma.
- The re-emergence of the “Move Up” buyer.

Chicago’s active “homes for sale” inventory was down 30% year-over-year in 2012. To put it in perspective, there were 23,000 homes for sale at the beginning of the Spring market in 2011. In 2012 at the same time period there were 18,400. That’s a 20% reduction in homes to choose from in the market. Conversely, the number of properties going under contract in 2012 versus 2011 increased at 23%. More contracts – less inventory sets the stage for increased competition and a stronger real estate market.
Slowing Foreclosure Market
 Nationally, December represented the lowest foreclosure filings (starts) in 71 months with most purchased before entering the market. The good news is that in Chicago, those falling behind on their payments and going “pre-foreclosure” also declined in 2012, with less Chicagoans under water on their mortgage payments as well. If you are looking for water damage restoration by inspecting the property thoroughly, check out water damage San Rafael they are ensuring that there is no presence of moisture. The bad news is that Chicago was one of 25 states that actually saw their foreclosure activity rise in 2012, having the fifth highest state foreclosure rate in the nation.
It takes an average 697 days for a property to complete the foreclosure  process in Illinois. Much of this is due to the fact that Illinois is one of 20 judicial states, where these properties are handled by local court systems. This judicial slowdown of the process has direct effects on the recovery process of housing prices as we are just not absorbing homes into the market that “went into foreclosure” in late 2010.
So what does this mean to Chicago in 2013? As stated above, we are still absorbing inventory into that market that started the foreclosure process years ago. However, we expect this number to decrease and pent up inventory to start making its way to the market. But don’t expect this to be able to take  advantage of many of these discounted properties as a typical buyer. Banks have started selling portfolios of these properties directly to investors – bypassing the traditional real estate market.
Growing Consumer Confidence
The biggest mindset change to the consumer in 2012 has probably been their belief that the improved market was here to stay – in other words confidence. Influenced by a number end-of-year statistics showing a slowly improving unemployment outlook, increased holiday spending, and an all-around more positive outlook on our financial future, it seems as if consumer confidence is on the mends
 Consumer Confidence in the United States is an index reflecting consumers’ perceptions of current business and employment conditions, as well as their expectations for six months hence regarding business conditions, employment, and income. The 2012 www.cobralocksmiths.com for the United States was roughly 69 and has shown steady improvement through 2011 and 2012.
This factor stands to be one of real estate’s greatest allies in 2013 and has  already been shown by the flurry of activity through traditional “down” months of November and December. In December of 2012, the number of properties going under contract was up 40% over December 2011, showing that transaction-ready buyers are bundling up and not allowing winter to slow their home search.
Continued historically low interest rates
2012 rates ended at near 3.4% with little indication of near term increases through mid-2013. However a number of high-profile prognosticators have said mortgage rates will rise in 2013. According to the Mortgage Bankers Association (MBA), however, these low rates won’t last through 2013.
 In its annual mortgage rate forecast, the MBA projects that the 30-year fixed will rise to 4.40% within the next 12 months. This is more than an entire percentage point higher than today’s mortgage rates; a shift that could severely damage buyer purchasing power, and may end the longest Refi Boom in recent history. However it should be noted that 4.40% would be the second lowest rate in US history.
Also, something to consider is that last year, the MBA rate forecast was way off. It predicted the 30-year fixed-rate mortgage would average 4.4% for 2012. Instead, rates plunged of a good short term loan company and hit an estimated annual average of 3.8%, spurring a flurry of refinance activity. Many people who are considering buying their first home can be overwhelmed by the myriad of financing options available. Fortunately, by taking the time to research the basics of property financing, homeowners can save a significant amount of time and money. Having some knowledge of the specific market where the property is located and whether it provides incentives to lenders may mean added financial perks for buyers. Buyers should Read here about Bitmex signals on smart options so they can get the right investment for themselves ad eventually get the financial help that they really need.
Read more: Financing Basics For First-Time Homebuyers https://www.investopedia.com/articles/mortgages-real-estate/08/homebuyer-financing-option.asp#ixzz5KVISAu6C
Follow us: Investopedia on Facebook. You can Click Here to learn more. Whatever the outcome, it’s safe to say that in 2013 rates will continue to hover near historical lows and welcome buyers into the market with low interest money. If you are looking for a local locksmith services and high quality security and lock products on a moment’s notice, visit quicklymiamilocksmith.com for more info.
Re-emergence of the Move Up Buyer
 If there’s one buying segment of consumers we have seen re-enter the market (and should continue to through 2013), it’s the move-up buyer. According to statistics provided by the Wall Street Journal, the “magic move up age” for these buyer/sellers is 35 – 44. About 36% of all buyers in late 2012 were 35 to 44, up from 30% at the start of 2009.
These consumers are looking to upgrade, adapt to life changes or other circumstances. This usually means larger homes with plenty of amenities that are located in good school districts, with features that make for convenient living and in urban areas like Chicago, neighborhood features, safety and public transportation.
Many move-up homebuyers are confident that prices have bottomed out and shrinking inventory has caused an uptick in demand for their local area. They’ve been waiting five years or longer to act, life events have taken place and now they’re ready to move into the next phase of their lives even if they are bringing money to the closing table.
Rental Rates Continue to Rise
This year, average rents have been rising nationally at about 4 percent a year and in many metro areas by 7 to 9 percent. A major driving factor for this increase in rental prices is a shadow demand in the rental market. 3 to 5 million people, most in their twenties and thirties, have been riding out the shaky economy by moving back in with their parents or staying with friends. Now, as they start to get jobs, they’re looking for their own apartments.
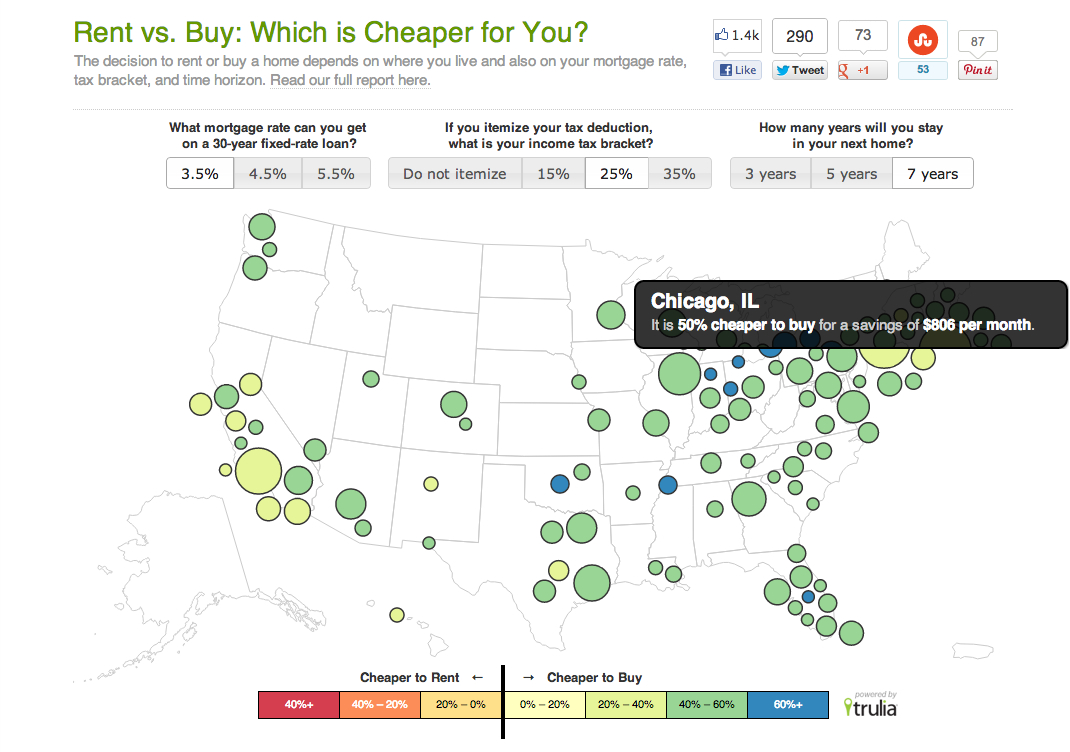 In Chicago, average rent prices have increased 20 percent from 2005 to 2012. Obviously this varies on the location, size and condition of unit, however renters are expecting to pay anywhere from $1700 – $3000 a month for a 2 bedroom in prime neighborhoods. This is good news for home sellers in the market as well. Rising prices, limited rental inventory and continued low interest rates have made the rent vs. buy discussion a serious discussion.
So, there you have it…a small taste of what’s actually happening out there. Please feel free to reach out to me to personally discuss and assess your own situation. As mentioned above, real estate is local… city by city, block by block.


{ 0 comments… add one now }